
实验要求
能够对数据进行预处理;能够使用随机森林算法构建学习失败预警模型;能够通过网格搜索方法对随机森林算法各项参数进行优化;能够应用scikit-learn中的支持向量机、逻辑回归和AdaBoost算法进行对比试验。
- 对数据进行预处理;
- 处理数据不平衡;
- 样本生成及标准化处理;
- 使用随机森林算法构建模型;
- 结果分析与可视化;
- 特征重要性分析;
- 与其他算法比较,并计算不同算法的准确率、查全率、F1值和AUC指标;
- 对几种模型的结果进行分析。
代码部分
main.py
import pandas as pd
import numpy as np
from sklearn.ensemble import RandomForestClassifier, AdaBoostClassifier
from sklearn.linear_model import LogisticRegression
from sklearn.metrics import recall_score, precision_score, accuracy_score, roc_auc_score, f1_score
from sklearn.model_selection import train_test_split
from sklearn.preprocessing import StandardScaler
from imblearn.over_sampling import SMOTE
from sklearn.tree import DecisionTreeClassifier
from sklearn.utils import resample
from sklearn.svm import SVC
import tkinter as tk
from tkinter import Label, Button, Toplevel
from matplotlib.backends.backend_tkagg import FigureCanvasTkAgg
import matplotlib.pyplot as plt
from pages import show_chart

# 设置显示选项
pd.set_option('display.max_columns', 100)

# 数据加载与预处理
def load_and_preprocess_data():
    df = pd.read_csv('uwide.csv', encoding='utf-8')
    factor = pd.factorize(df['SEX']) #因子化,转换成整数编码
    df['SEX'] = factor[0]
    df = df.fillna(0)#缺失值替换为0
    df['ssate'] = np.where(df['TOTALSCORE'] >= 60, 1, 0) #新建ssate列,总成绩大于等于60的为1,否则为0
    df = df[['BROWSER_COUNT', 'COURSE_COUNT', 'COURSE_AVG_SCORE', 'EXAM_AH_SCORE', 'EXAM_WRITEN_SCORE', 'EXAM_MIDDLE_SCORE',
             'EXAM_LAB', 'EXAM_PROGRESS', 'EXAM_GROUP_SCORE', 'EXAM_FACE_SCORE', 'EXAM_ONLINE_SCORE', 'NODEBB_CHANNEL_COUNT',
             'NODEBB_TOPIC_COUNT', 'COURSE_SUM_VIDEO_LEN', 'SEX', 'GRADE', 'EXAM_HOMEWORK', 'EXAM_LABSCORE', 'EXAM_OTHERSCORE',
             'NODEBB_PARTICIPATIONRATE', 'COURSE_WORKTIME', 'COURSE_WORKCOMPLETERATE', 'NODEBB_POSTSCOUNT',
             'NODEBB_NORMALBBSPOSTSCOUONT', 'NODEBB_REALBBSARCHIVECOUNT', 'NORMALBBSARCHIVECOUNT', 'COURSE_WORKCOUNT',
             'HOMEWORKSCORE', 'WRITTENASSIGNMENTSCORE', 'MIDDLEASSIGNMENTSCORE', 'ssate']] #选择需要的特征和标签
    return df

def balance_data(df):#处理数据不平衡,下采样
    df_major = df[df.ssate == 1]
    df_minor = df[df.ssate == 0]
    df_major_down = df_major
    if len(df_major) > len(df_minor) * 8:
        new_major_count = len(df_minor) * 8
        df_major_down = resample(df_major, replace=False, n_samples=new_major_count, random_state=66)
    df_balanced = pd.concat([df_major_down, df_minor])
    return df_balanced

def split_and_scale_data(df):#划分训练集和测试集
    X = df.iloc[:, :-1].values
    Y = df.iloc[:, -1].values
    X_train, X_test, Y_train, Y_test = train_test_split(X, Y, test_size=0.3, random_state=27)
    sm = SMOTE(random_state=27)#合成少数过采样技术
    X_train_res, Y_train_res = sm.fit_resample(X_train, Y_train)
    scaler = StandardScaler() #特征进行标准化,使它们具有均值为 0 和方差为 1
    X_train_res = scaler.fit_transform(X_train_res)#计算均值和方差后标准化
    X_test = scaler.transform(X_test)
    return X_train_res, X_test, Y_train_res, Y_test

# 模型训练与评价
def evaluate_model(clf, X_train, Y_train, X_test, Y_test):
    clf.fit(X_train, Y_train)
    Y_pred = clf.predict(X_test)
    Y_pred_proba = clf.predict_proba(X_test)[:, 1] if hasattr(clf, "predict_proba") else Y_pred #计算每个样本属于每个类别的概率
    return {
        "model": clf,  # 返回训练好的模型对象
        "accuracy": accuracy_score(Y_test, Y_pred),
        "recall": recall_score(Y_test, Y_pred),#所有实际为正例的样本中,模型正确预测为正例的比例
        "precision": precision_score(Y_test, Y_pred),#所有模型预测为正例的样本中,实际为正例的比例
        "f1_score": f1_score(Y_test, Y_pred),#精确率和召回率的调和平均值
        "roc_auc": roc_auc_score(Y_test, Y_pred_proba)#模型预测结果的可靠性和有效性
    }

# 计算特征重要性
def calculate_feature_importance(clf, feature_names):
    importances = clf.feature_importances_ #随机森林训练后得到的特征重要性数组
    indices = np.argsort(importances)[::-1] #对特征重要性进行降序排序,并返回索引
    feature_importance = []
    for f in range(len(feature_names)):
        feature_importance.append((feature_names[indices[f]], importances[indices[f]]))
    return feature_importance

# 显示特征重要性图表
def visualize_feature_importance(feature_importances, parent_window=None):
    new_window = Toplevel()#顶级窗口对象
    new_window.title("Feature Importance Visualization")
    window_width = 1400
    window_height = 800

    screen_width = new_window.winfo_screenwidth()
    screen_height = new_window.winfo_screenheight()

    # 计算窗口左上角坐标使其居中
    window_x = (screen_width - window_width) // 2
    window_y = (screen_height - window_height) // 2 - 50

    new_window.geometry(f"{window_width}x{window_height}+{window_x}+{window_y}")
    new_window.configure(bg="AliceBlue")
    new_window.resizable(True, True)


    fig, ax = plt.subplots(figsize=(12, 8))  # 增加图形的高度和宽度
    y_pos = range(len(feature_importances))
    ax.barh(y_pos, [imp[1] for imp in feature_importances], align="center")#绘制水平条形图
    ax.set_yticks(y_pos)#设置 y 轴刻度位置
    ax.set_yticklabels([imp[0] for imp in feature_importances], fontsize=10)  # 调整字体大小
    ax.set_xlabel("Feature Importance")
    ax.set_ylabel("Feature")
    ax.set_title("Random Forest Feature Importance")
    plt.tight_layout()  # 确保图形不重叠

    canvas = FigureCanvasTkAgg(fig, master=new_window)#创建一个 FigureCanvasTkAgg 对象,将之前创建的 Matplotlib 图形 fig 嵌入到 new_window 主窗口中
    canvas.draw()#绘制
    canvas.get_tk_widget().pack(side=tk.TOP, fill=tk.BOTH, expand=1)#expand = 1 允许控件在窗口的所有可用空间内扩展,以填充其父容器

    if parent_window:
        parent_window.attributes('-topmost', False)  # 取消主界面的顶层设置

    new_window.mainloop()

# 显示随机森林结果可视化
def visualize_rf_results(results, parent_window=None):
    new_window = Toplevel()
    new_window.title("Random Forest Model Results Visualization")
    window_width = 1400
    window_height = 900

    screen_width = new_window.winfo_screenwidth()
    screen_height = new_window.winfo_screenheight()

    # 计算窗口左上角坐标使其居中
    window_x = (screen_width - window_width) // 2
    window_y = (screen_height - window_height) // 2 - 50

    new_window.geometry(f"{window_width}x{window_height}+{window_x}+{window_y}")
    new_window.configure(bg="AliceBlue")
    new_window.resizable(False, False)


    fig, ax = plt.subplots(2, 2, figsize=(12, 10)) #创建了一个包含 2 行 2 列的子图网格

    metrics = ["accuracy", "recall", "precision", "f1_score"]
    for i, metric in enumerate(metrics):
        row, col = i // 2, i % 2 #计算位置
        ax[row, col].bar(["Random Forest"], [results["Random Forest"][metric]], width=0.4) #绘制柱状图
        ax[row, col].set_title(metric.capitalize(), fontsize=14) #标题字母大写

        # 显示数值,并设置精度
        for bar in ax[row, col].patches:#遍历当前子图中的每个柱状图条
            ax[row, col].annotate(f"{bar.get_height():.8f}", (bar.get_x() + bar.get_width() / 2, bar.get_height()),
                                  ha='center', va='center', xytext=(0, 5), textcoords='offset points')  #设置具体的数值,像素偏移方式

    plt.tight_layout()#自动调整子图参数

    canvas = FigureCanvasTkAgg(fig, master=new_window)
    canvas.draw()
    canvas.get_tk_widget().pack(side=tk.TOP, fill=tk.BOTH, expand=1)

    if parent_window:
        parent_window.attributes('-topmost', False)  # 取消主界面的顶层设置

    new_window.mainloop()

# 显示欢迎页面
def show_welcome_screen():
    welcome_window = tk.Tk()
    welcome_window.overrideredirect(True)#无边框的顶级窗口

    # 加载并显示图片
    welcome_photo = tk.PhotoImage(file='logo.png')
    label_photo = tk.Label(welcome_window, image=welcome_photo)
    label_photo.pack()  # 使用pack方法居中显示图片
    image_width = welcome_photo.width()
    image_height = welcome_photo.height()

    # 获取屏幕宽度和高度
    screen_width = welcome_window.winfo_screenwidth()
    screen_height = welcome_window.winfo_screenheight()

    # 设置窗口位置居中
    window_x = (screen_width - image_width) // 2
    window_y = (screen_height - image_height) // 2
    welcome_window.geometry(f"{image_width}x{image_height}+{window_x}+{window_y}")

    welcome_window.attributes('-topmost', True)
    welcome_window.after(2000, lambda: welcome_window.destroy())  # 2秒后销毁欢迎页面

    welcome_window.mainloop()

# 显示主页面
def show_main_window(results, X_train, feature_names):
    mainwindow = tk.Tk()
    mainwindow.title("主页面")
    window_width = 1200
    window_height = 600

    # 获取屏幕宽度和高度
    screen_width = mainwindow.winfo_screenwidth()
    screen_height = mainwindow.winfo_screenheight()

    # 计算窗口左上角坐标使其居中
    window_x = (screen_width - window_width) // 2
    window_y = (screen_height - window_height) // 2 - 50

    mainwindow.geometry(f"{window_width}x{window_height}+{window_x}+{window_y}")
    mainwindow.configure(bg="AliceBlue")
    mainwindow.resizable(False, False)

    # 添加label控件
    l_main_1 = Label(mainwindow, text='本代码实现了随机森林、支持向量机、逻辑回归和AdaBoost算法', height=10, width=50,
                     bg="AliceBlue", font=('微软雅黑 20 bold'))
    l_main_1.place(x=165, y=-110)
    l_main_2 = Label(mainwindow, text='点击查看不同算法性能对比', height=5, width=20, bg="AliceBlue",
                     font=('微软雅黑 15 bold'))
    l_main_2.place(x=110, y=370)
    photo_xiajiantou = tk.PhotoImage(file='向下箭头.png')
    photo_xiajiantou = photo_xiajiantou.subsample(3, 3)
    l_main_3 = Label(mainwindow, height=65, width=50, bg="AliceBlue", image=photo_xiajiantou)
    l_main_3.place(x=70, y=420)
    l_main_4 = Label(mainwindow, text='点击查看随机森林训练结果', height=5, width=20, bg="AliceBlue",
                     font=('微软雅黑 20 bold'))
    l_main_4.place(x=365, y=100)
    photo_rightjiantou = tk.PhotoImage(file='右箭头.png')
    photo_rightjiantou = photo_rightjiantou.subsample(3, 3)
    l_main_5 = Label(mainwindow, height=65, width=50, bg="AliceBlue", image=photo_rightjiantou)
    l_main_5.place(x=715, y=160)
    l_main_6 = Label(mainwindow, text='特征重要性分析', height=5, width=20, bg="AliceBlue",
                     font=('微软雅黑 20 bold'))
    l_main_6.place(x=470, y=228)
    photo_leftjiantou = tk.PhotoImage(file='左箭头.png')
    photo_leftjiantou = photo_leftjiantou.subsample(3, 3)
    l_main_7 = Label(mainwindow, height=65, width=50, bg="AliceBlue", image=photo_leftjiantou)
    l_main_7.place(x=467, y=290)

    # 添加button控件
    button_data = [
        ("Accuracy", [results[model]["accuracy"] for model in results],40,500),
        ("Recall", [results[model]["recall"] for model in results],275,500),
        ("Precision", [results[model]["precision"] for model in results], 510,500),
        ("F1 Score", [results[model]["f1_score"] for model in results],745,500),
        ("ROC AUC", [results[model]["roc_auc"] for model in results],980,500),
        ("Feature Importance", lambda: visualize_feature_importance(
            calculate_feature_importance(results["Random Forest"]["model"], feature_names),  mainwindow),
         160, 290),
        ("RF Results", lambda: visualize_rf_results(results,mainwindow), 795, 160)
    ]

    for text, data, x, y in button_data:
        if callable(data):
            btn = Button(mainwindow, text=text, font=('微软雅黑 20 bold'), height=1, width=16, command=data)
        else:
            btn = Button(mainwindow, text=text, font=('微软雅黑 20 bold'), height=1, width=9,
                         command=lambda d=data, t=text.lower(): show_chart(t, d,mainwindow))
        btn.place(x=x, y=y)

    mainwindow.attributes('-topmost', True)
    mainwindow.mainloop()


# 主函数
if __name__ == "__main__":
    df = load_and_preprocess_data()
    df_balanced = balance_data(df)
    X_train, X_test, Y_train, Y_test = split_and_scale_data(df_balanced)

    models = {
        "Random Forest": RandomForestClassifier(criterion='entropy', random_state=27, n_jobs=-1),
        "Support Vector Machine": SVC(probability=True, random_state=27),
        "Logistic Regression": LogisticRegression(),
        "AdaBoost": AdaBoostClassifier(DecisionTreeClassifier(max_depth=3), n_estimators=500, learning_rate=0.5, algorithm='SAMME')
    }

    results = {}
    for name, clf in models.items():
        results[name] = evaluate_model(clf, X_train, Y_train, X_test, Y_test)

    feature_names = df.columns[:-1]

    show_welcome_screen()
    show_main_window(results, X_train, feature_names)
Pages.py
import tkinter as tk
from matplotlib.backends.backend_tkagg import FigureCanvasTkAgg
import matplotlib.pyplot as plt
import numpy as np


def show_chart(chart_type, shuju, parent_window=None):
    # 设置算法名称
    algorithms = ['Random Forest', 'Support Vector Machine', 'Logistic Regression', 'AdaBoost']

    # 设置柱状图的x轴位置和宽度
    x = np.arange(len(algorithms))
    width = 0.35

    # 创建Matplotlib图形
    fig, ax = plt.subplots(figsize=(10, 6))

    # 绘制柱状图
    rects1 = ax.bar(x, shuju, width, color=['gray', 'pink', 'orange', 'gold'])

    # 添加一些文本用于标签、标题和自定义x轴刻度标签
    ax.set_xlabel('Algorithms')
    ax.set_ylabel(chart_type)
    ax.set_title(f'Comparison of Different Algorithms {chart_type}')
    ax.set_xticks(x)
    ax.set_xticklabels(algorithms)

    # 修改图例颜色
    custom_legend = ax.legend([rects1], [chart_type], loc='lower center', fontsize=10, frameon=True, facecolor='white',
                              edgecolor='black')
    for text in custom_legend.get_texts():
        text.set_color('black')

    # 添加数据标签
    def autolabel(rects):
        """在每个条形图上方添加文本标签"""
        for rect in rects:
            height = rect.get_height()
            ax.annotate('{}'.format(height),
                        xy=(rect.get_x() + rect.get_width() / 2, height),
                        xytext=(0, 3),
                        textcoords="offset points",
                        ha='center', va='bottom')

    autolabel(rects1)

    # 自动调整子图布局
    fig.tight_layout()

    # 创建Tkinter应用程序窗口
    root = tk.Tk()
    root.title(f"算法{chart_type}对比")

    window_width = 1200
    window_height = 600

    screen_width = root.winfo_screenwidth()
    screen_height = root.winfo_screenheight()

    # 计算窗口左上角坐标使其居中
    window_x = (screen_width - window_width) // 2
    window_y = (screen_height - window_height) // 2 - 50

    root.geometry(f"{window_width}x{window_height}+{window_x}+{window_y}")
    root.configure(bg="AliceBlue")
    root.resizable(False, False)

    # 创建Matplotlib的画布,并将其嵌入到Tkinter窗口中
    canvas = FigureCanvasTkAgg(fig, master=root)
    canvas.draw()
    canvas.get_tk_widget().pack(side=tk.TOP, fill=tk.BOTH, expand=1)

    # tk.attributes('-topmost', True)

    if parent_window:
        parent_window.attributes('-topmost', False)  # 取消主界面的顶层设置

    # 运行Tkinter主消息循环
    tk.mainloop()
运行结果截图
1.启动页面
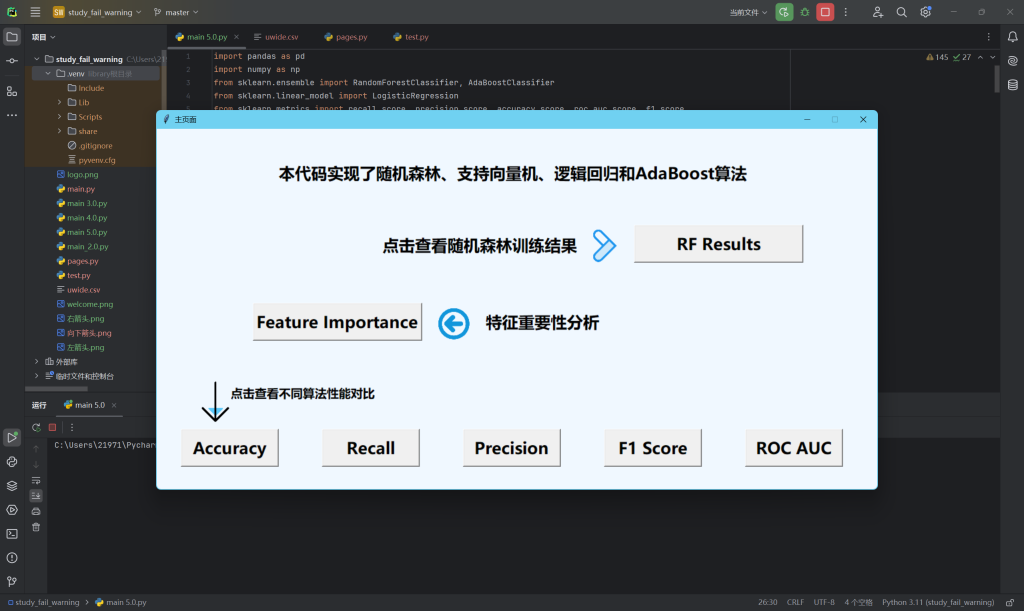
2.主页面
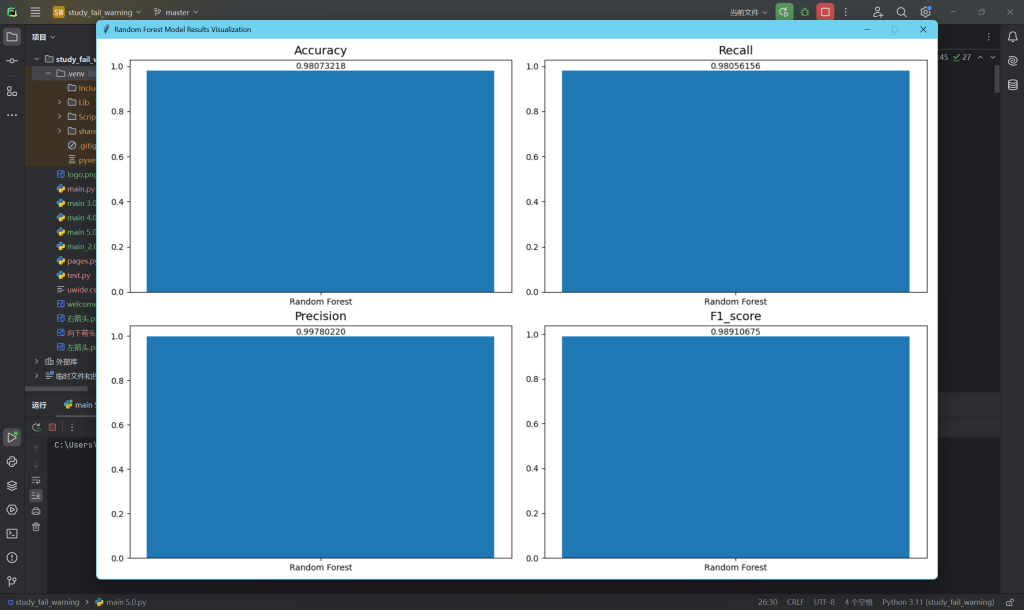
3.随机森林算法运行结果
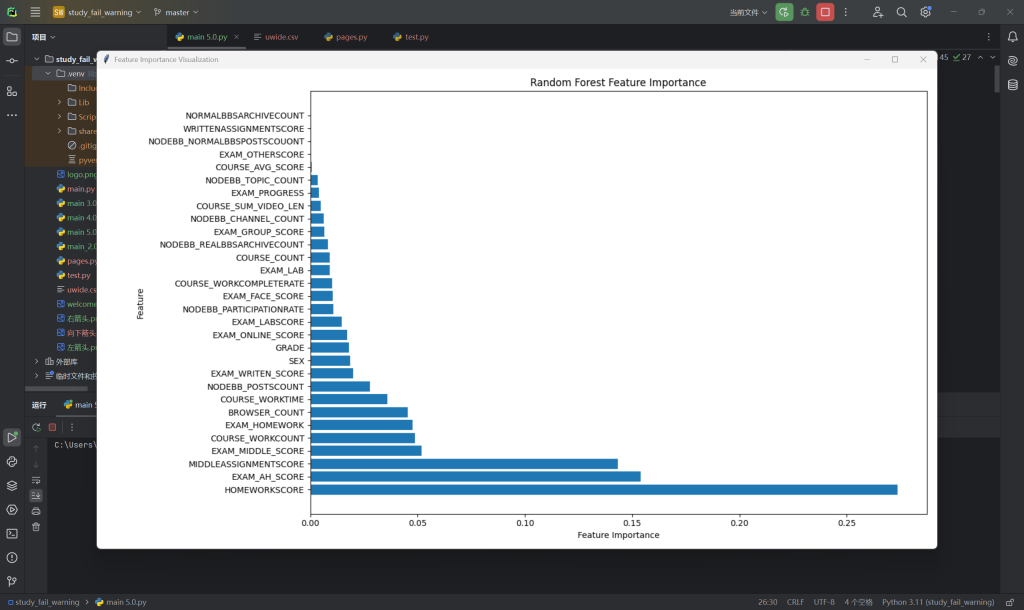
4.特征重要性分析
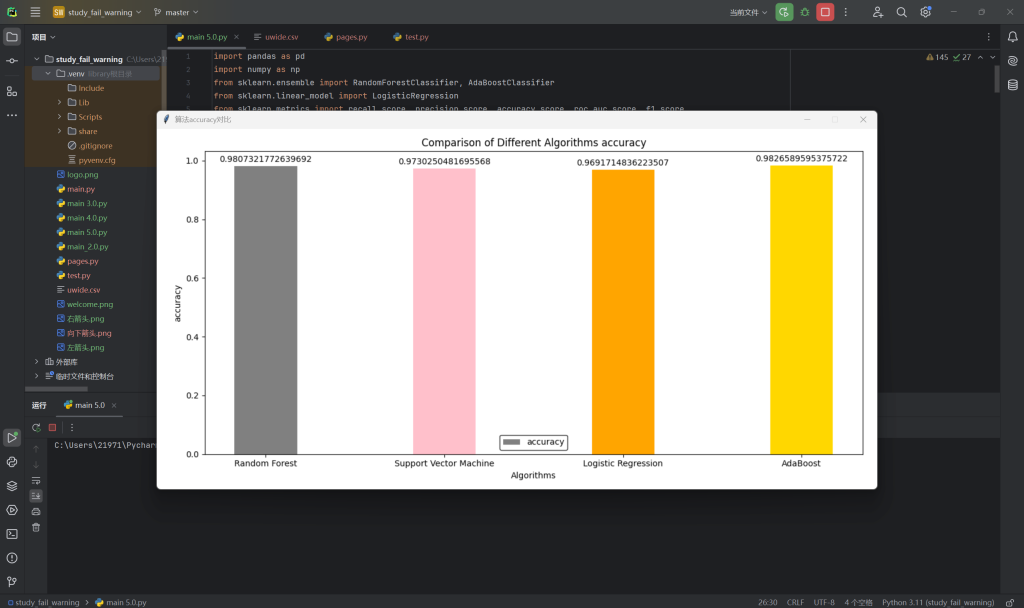
5.不同算法比较-准确率
6.不同算法比较-精准率

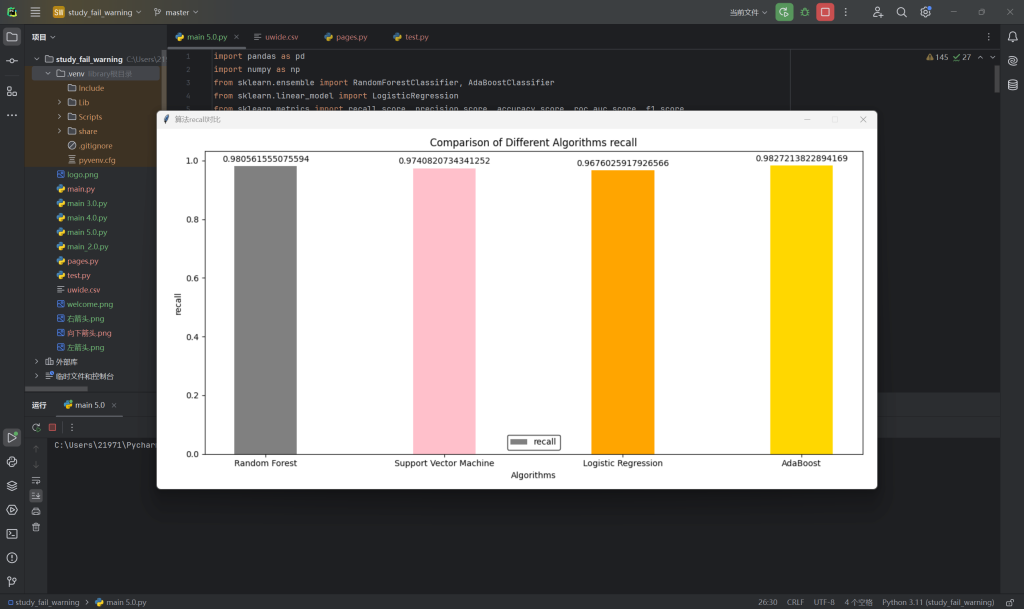
7.不同算法比较-召回率
8.不同算法比较-F1值

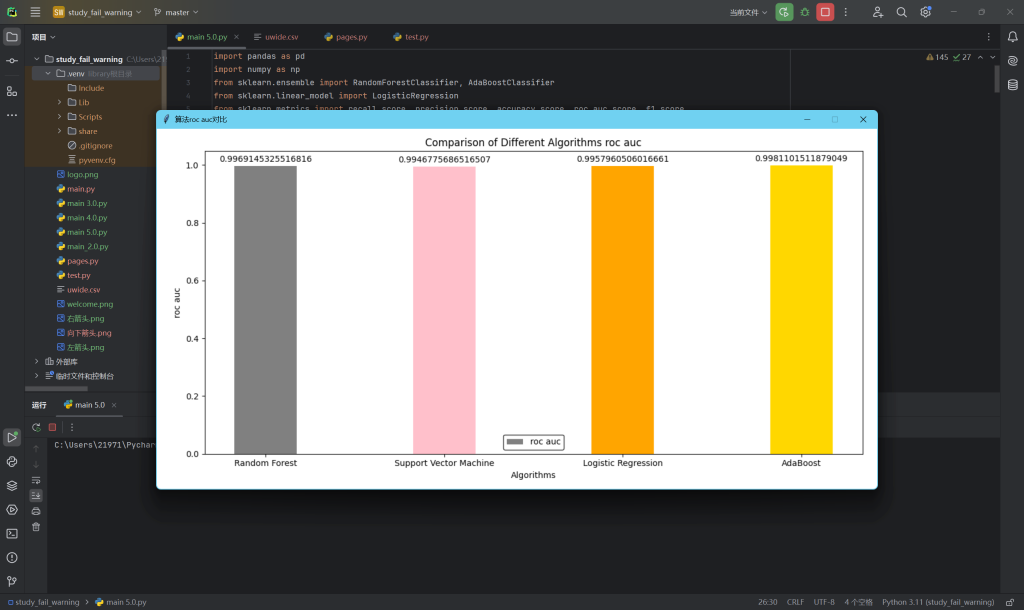
9.不同算法比较-ROC AUC
代码打包
夸克网盘
链接:https://pan.quark.cn/s/d0bc7e0b587a
提取码:MaxM
Comments NOTHING